 I just finished reading this book which title explains the topic and here is my summary of important bits, consider it a cheat-sheet so you don’t have to read the whole book. I’ve also deliberately missed some the waffle when the authors go and talk about getting a stable internet connection and the powerful enough computer – in detail.
Instead I’ll get to the crux of it focusing on technical analysis – analysing charts rather then fundamental analysis (company’s balance sheet, earnings and other numbers). What I was interested is how to best identify a good trading opportunities, how do you find stocks that are about to enter an up-trend so one can ride that up trend and then how to recognise that the trend has been exhausted and it’s time to sell which is what it’s all about – making money.
The number one reason 90% of traders lose money is they are too emotional. You should never bet on fundamentals. To be consistent in trading you need to be technical and have ice water in your veins. You have to be flexible and move with the trend. Inflexibility is not compatible with trading. The more you trade thinking you will limit your risk, the higher the losses will be. You are your own enemy. The entire object here to trade demands CONFIDENCE and that only comes by understanding the trend set in motion globally. Those who buy or sell on the next GDP number are clueless to the international trends in motion.
~ Martin Armstrong of www.armstrongeconomics.com
Technical Analysis
Technicians examine price history, trading volume, and additional market statistics to evaluate the balance between supply and demand. The conceptual framework is easy to understand. As long as prices are rising, demand exceeds supply, and buyers are more interested in buying than sellers are in selling. The reverse is equally true. When prices are falling, supply exceeds demand, and sellers are more interested in selling than buyers are in buying. When a stock trades within a tight range of prices, a balance between supply and demand has been achieved. This situation is evident on the price chart when a stock trades within a trading range.
Bar Charts
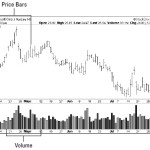
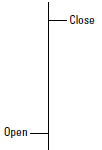
 The single most popular way to display a stock price is via a bar chart. A single price bar can represent 1 day of trading or one week, month quarter or a year of trading – hence the daily, weekly, monthly, quarterly or yearly charts.
Trading Volumes
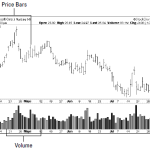
In addition to prices, bar charts often show the volume, or the number of shares traded during the given time period represented by each bar. On a daily chart, trading volume shows the total number of shares traded throughout the day. By convention, the volume is shown as a separate bar graph and usually is shown directly underneath the price chart.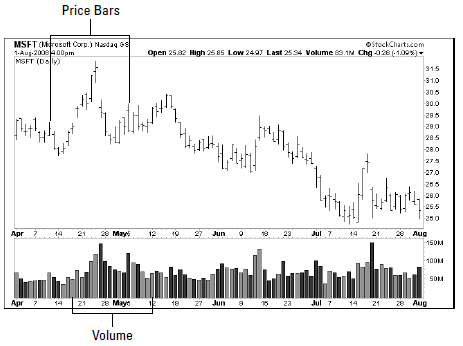
Single bar patterns
Bullish single-bar pattern
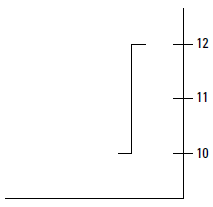 Although each price bar is best looked at in a context of it’s most recent neighbouring bars, each individual bar can tell a story on it’s own and this is where bullish or bearish single-bar patterns come into play.
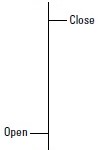
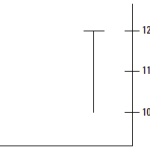
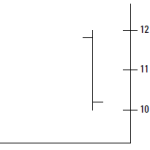
A single bullish bar scenario is when the market opens near the the trading range’s low and closes on or close to the trading range’s high meaning that the stock/market generally went UP throughout the trading frame (day, week, month or longer) and closed HIGH.
Bearish single-bar pattern
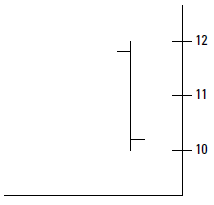 Bearish single-bar pattern occurs opposite to the bullish pattern as you may have guessed it and is when stock opening price is close to the top of the trading range (highest point) and closing price is on or near the bottom meaning that the stock spent most of the trading in a DOWN direction before closing LOW.
Bullish reversal pattern
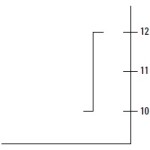
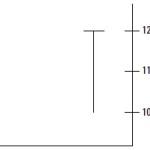
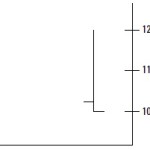
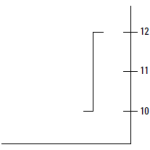
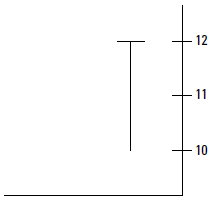 This is another single bar pattern that shows a stock opening price being close to the trading top, stock then trading down most of the day only to reverse direction and head UP and close on or close to the HIGH. I’d call this a temp dip.
If you see this pattern after a period of falling price this may represent a BUYING opportunity.
Bearish reversal pattern
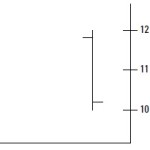
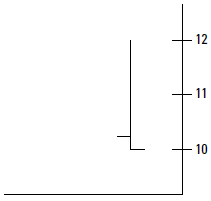 It’s a scenario where the stocks spends most of the trading in the positive territory in respect to it’s opening price and then it reverses DOWN to finish near or on the LOW.
If you see this patter after a period of rising price it may be a signal to SELL.
TAKEAWAY: Reversal patterns often represent a powerful single-bar trading pattern. Whenever a bullish reversal bar is preceded by several periods of falling prices, for example, its pattern often represents a buying opportunity. On the other hand, when a bearish reversal bar is preceded by a rising trend, it may be a signal to close a long position.
Trend is your friend – how to identify one
Position traders or investors (not day traders) are interested in identifying a prevailing trend that lasts several weeks or months.
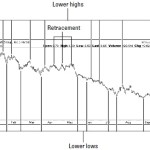
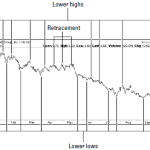
Stocks and markets can trade in up, down trend or within a trading range – range bound. In general trading range bound stocks are not interesting for trading. We are however looking for a break-out from the trading range as those stocks can begin their up-trend and are good candidates for profitable trading. The simple way to describe the up trend is when the stock price continues to reach higher intermittent highs and higher lows (lows don’t fall bellow previous lows). Lower highs and lower lows is the opposite – the downtrend.
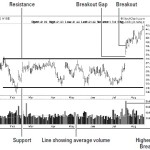
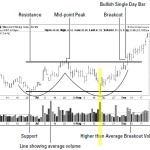
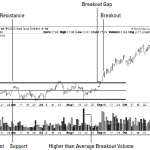
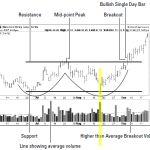
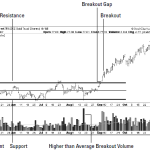
Support is a line that connect the lower trading ranges for a given time frame where a resistance is always the upper trading-range boundary line. Closing prices on a daily or weekly bar chart can work best when drawing support and resistance lines.
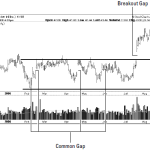
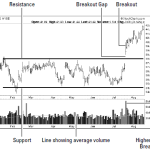
Breakout signals a point at which a stock has broken free from the trading range however this breakout needs to be significant by 5 or 10% or more to signify a beginning of an uptrend. At the same time the volume needs to be higher even 50% or more higher than the average is a positive sign. Breakout gap is when a stock’s opening price is well above it’s previous close and it moves up while breaking out of it’s trading range. More narrow trading range is better and also to confirm the break out you’d ideally want to wait a day or 2 making sure stock doesn’t drop back down below the resistance line.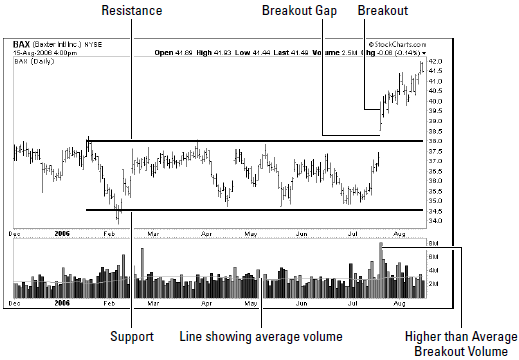
Double-bottom pattern can be a good buying signal as well.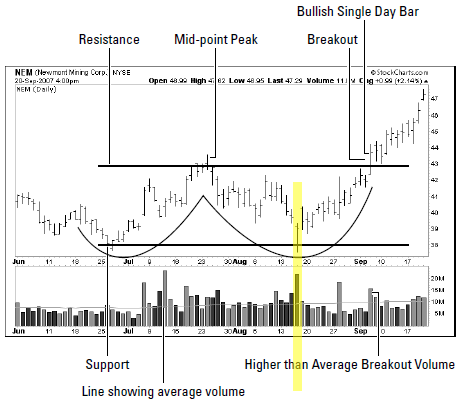
In this example if you want to be aggressive you can enter at the highlighted portion as there was a single day reversal pattern at the bottom of the trough and the entry would be the next trading day. If the stock falls below the lowest low then you MUST exit the trade as the trading signal failed. Or to be on a safe side you can enter at a point where ‘breakout’ is marked.
Beware of a ‘retracement’
During a prevalent trend we sometimes see anomalies where the trend seems to be interrupted in this case the down trend is interupted with higher hight and higher lows only to continue its course lower. So please anticipate these anomalies that can muck up your trading strategy.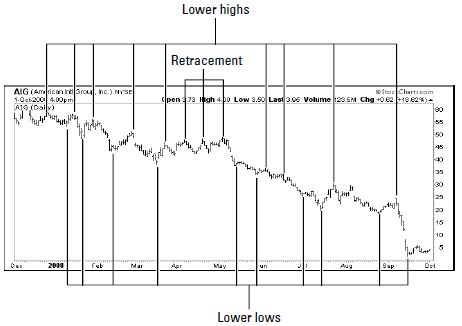
Drawing trend lines to show support
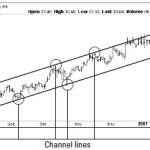
Trend lines are drawn underneath a trend and are related to the support lines when drawing a trading range. One hint that the book gives is that you can try and draw the trend line from right to left instead as long as they make sense and constantly question your information and method.
Trading Channel
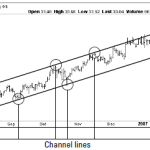
Channels are similar to trading ranges except that they follow the trend so instead of being parallel support and resistance lines they’re sloping up or down depending on a trend.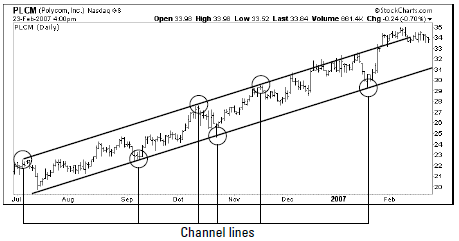
Trend lines and channels are not a recommended as a primary tool (only guidance) to determine entry and exit positions however can be good to confirm primary trading tools or justify current positions. They work better over a longer rather then shorter period of time and also try daily and then weekly charts for confirmations.
Price Gaps
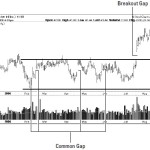
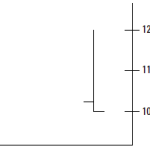
A price gap forms on a bar chart when the opening price of the current bar is above or below the closing price of the previous bar. Gaps occur mostly on daily charts, sometimes on weekly charts, and rarely on intraday charts. Depending on the circumstances, gaps can show continuation and reversal patterns, and they can signal an opportunity to enter or exit a position.
Notice below 2 types, common gab (occurs within trading range, happens often and we’re not interested in it) and breakout gap – it is strongest when the opening and the low of the price bar are higher then the high of the previous bar, see below and note the higher volume as well as a confirmation of a break out. When dealing with a breakout gap, a stock price that falls back through the trading range resistance zone and fills the gap is likely to be a bearish development and time to exit the position. 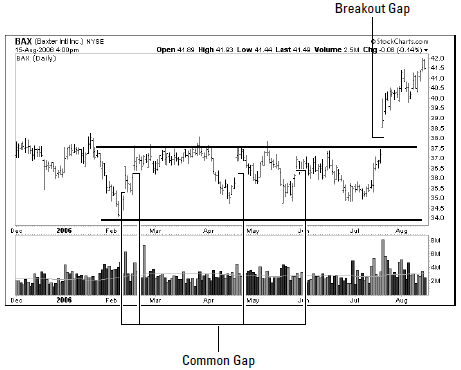
Failed Signals
Bull traps, which occur after an upside breakout. The stock breaks out of its trading range to the upside but then reverses back into the trading range and ultimately breaks out to the down side.
Bear traps, which occur after a downside breakout. This opposite scenario to the bull trap often is very bullish. The stock reverses course and reenters the trading range. If a bear trap occurs within a trading range that’s preceded by a long period of declining prices, it often represents an excellent buying opportunity, because it’s a sign that selling pressure has evaporated in the stock, which thus is likely to attempt an upside breakout. Whenever you see a potential bear trap taking place and the stock meets all of your fundamental criteria, you may want to enter a long position as soon as the stock price re-enters the trading range.
Moving averages
A moving average is a trading indicator that shows the direction and magnitude of a trend over a fixed period of time. Some traders call it a price overlay, because it’s superimposed over the price data in a bar chart. There are two types being simple moving average (SMA) and exponential moving average (EMA).
EMA has an advantage of having ‘longer memory’ and EMA calculations place additional weight on the most recent price. Traders use moving averages to trigger buy and sell signals. In general, when a moving average slopes upward, you can infer that the trend is up, and when the moving average slopes downward, the trend is down.
One simple mechanical strategy that some traders employ works like this:
- Buy when the moving average slopes upward and the closing price crosses above the moving average.
- Close the position when the price closes below the moving average.
- Sell short when the moving average slopes downward and the closing price crosses below the moving average.
- Close the short position when the price closes above the moving average.
To be sure, wait few days making sure that the price remains above/below the moving average before you buy/sell.
These rules tend to work best when the stock is trending and fail miserably when the stock is in a trading range. Moving averages can act as an area of resistance.
Buying on a pullback is employed by some short term traders when a stock is in an uptrend while price above moving average and then it dips down to touch or cross the moving average hoping that the stock will bounce off the moving average higher i.e. buying the dips.
Stochastic Oscillators
This scale is 0 to 100 and reading of more than 80% implies and overbought position where a reading below 20% are interpreted as oversold condition. These conditions can persist for a long time so on it’s own they are NOT a trading trigger. Instead:
Buy signal – when SO crosses from under to over 20%
Sell signal – when SO moves from above to below 80%
Similar/Same? index: RSI or Relative Strength Index’s thresholds are 30% and 70%
Moving average convergence divergence indicator (MACD)
It oscillates below and above the centre line

The MACD line (the solid line) crosses over the zero centre line during the third week in February. This was a buy signal for this stock. You might also notice that the MACD line crossed the signal line in early January 2006. This MACD crossover signal is another early indication suggesting a possible new up-trend.
Buy signal: when MACD line crosses above centre line or for short-term traders when MACD line crosses above signal line
Sell signal: when MACD line crosses below centre line or for short-term traders when MACD line crosses below the signal line
The short term trader approach generates too many false signals and is not that reliable.
Each time the MACD line crosses above or below the signal line suggests a potential change in the direction of the dominant trend, not a buying signal but may suggest a change is coming.
Setting stop-loss price
Rather than using a set percentage drop in the stock price as a stop-loss price, it is recommended that technical analysis are used to determine the time to exit.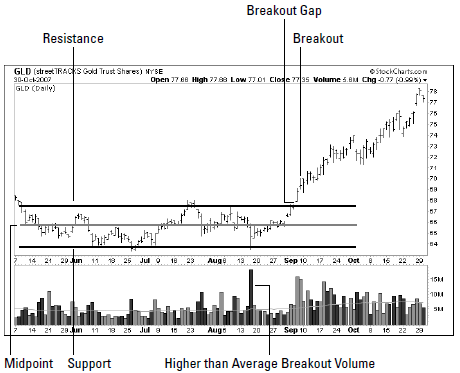
Two schools of thought here (I prefer the first one). Breakout is the point to enter the trade (or higher than average breakout volume point above if you’re more aggressive) but how do you decide when to exit if the trade has failed?
- Exit when the price declines below resistance – you’re risking less but could be stopped-out of the trade
- Exit when the price declines below midpoint – you’re risking more but you’re less likely to be stopped out of a winning trade
Note some of the trading terms here.
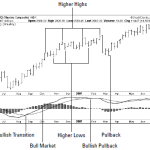
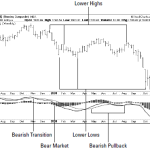
Bullish transition: The market is transitioning from a bear market to a
bull market.
Bull market: A persistent rising trend in the market.
Bullish pullback: A bull market in the midst of a pullback.
Bearish transition: The market is transitioning from a bull market to a
bear market.
Bear market: A persistent downtrend.
Bearish pullback: A bear market in the midst of a consolidation.
This is bull market. A bull market is indicated when the MACD line is greater than the zero line and greater than the trigger line.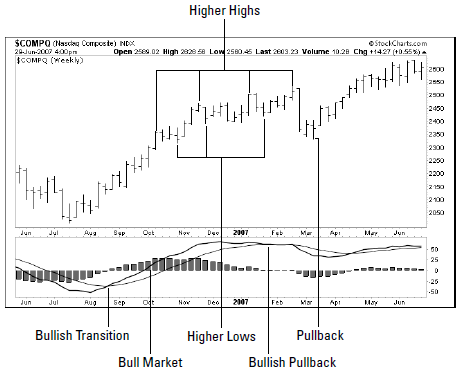
This is bear market. A bear market is indicated when the MACD line is less than the zero line and less than the trigger line.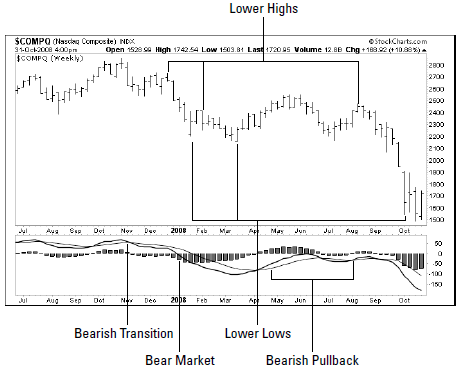
Short selling
The best way to understand selling stocks short is to think of it as selling something that you don’t have, it’s the shares that your broker has in his inventory or more likely from other clients.
So, the idea is to SELL first HIGH and then BUY later LOW meaning that you’re hoping that the stock price will be going down in the future.
To close the position you buy shares on the open market and return them to your broker.
Paying dividends to the lender? Well yes. If the stocks pay a dividend during the time a short seller holds a position, short sellers pay the dividends on the ex-dividend date to the people who loaned them the stocks. Short sellers need to keep the ex-dividend date in mind whenever shorting stocks.
Because of the above sell now and buy later, this creates future buying pressure. This can cause the price of heavily shorted stock to jump dramatically if all the short sellers simultaneously run to get out of their positions as the price rises – this is called a short squeeze.
Derivatives (ETFs, futures and options)
Derivatives are any financial instruments that get or derive their value from another financial security, which is called an underlier. This underlier is usually stocks, bonds, foreign currency, or commodities. The derivative buyer or seller doesn’t have to own the underlying security to trade these instruments.
Futures
Futures are legally binding contracts between two parties, one of whom agrees to buy and the other who agrees to sell an asset for a specific price at a specified
time in the future. The specific price is known as the strike price.
Short positions: The party in the contract who agrees to deliver the commodity, stock, or bond holds a short position. Traders who take short positions are expecting the price of the underlying commodities to go down.
Long positions: The party in the contract who agrees to buy the commodity, stock, or bond in a futures contract holds a long position on the security. Traders who buy long positions are expecting the price of the underlying commodities to go up.
Commodities futures including farm products or precious metals and many others. Index futures follow the direction of the value of the indexses like All Ordinaries in Australia or S&P 500 in the US. Foreign currency futures also exist.
Options
The big advantage that options have over futures is that you buy the right to exercise the option contract, and yet you still can decide to allow the option to expire without ever exercising that right. When you let an option expire, you lose only the amount you paid for the option (the premium) and not the full amount that otherwise can be lost in trading the underlying asset.
Option sellers take the riskier stance, because they can lose the value of whatever asset they promised to sell or buy if the option buyer decides to exercise the option.
Puts: A put option is a contract that gives the buyer the right to sell (for a higher agreed value than the current value is hence making a profit) a particular asset at a specified price at any time during the life of the option. A buyer of puts is expecting the value of the asset to go DOWN.
Calls: A call option is a contract that gives the buyer the right to buy a particular asset at a specified price (hoping that the specified price is lower than the current price) at any time during the life of the option. Buyer of call options is expecting/betting the asset price to go UP in value.
The expiration date is the last day that an option buyer can exercise the rights specified in the contract.
Strike price is the agreed price that the option can be exercised
An option is said to be in-the-money when it’s worthwhile to exercise the option or out-of-money when an option owner would lose money if they sell it. At-the-money is breaking even, i.e. the strike price of the option is the same as the current market value of the option.
Option pricing depends on 3 factors:
The longer the date of expiration the more expensive the premium as an option holder has more time for that option to become ‘in the money’.
When the current market price moves more and more out-of-money (away from the strike price) the premium price gets lower and lower.
The more volatility the more chance of the underlining asset to end up in-the-money before the expiration date so higher volatility the higher the premiums.
Master your emotions
There are a few things that I recommend you do to banish emotions from your investing activities.
The first thing is to recognise your inherent bias. People are either naturally bullish, or naturally bearish. Recognise what category you fall into, and learn to see it as your weakness. If you do this, you can consciously try to compensate for your inbuilt bias.
I believe markets are a replication of nature, albeit a complex form of nature. Nature is all about balance, so if you can balance your emotions you will do well.
As the great trader WD Gann said, learn to be a bull in bull markets, and a bear in bear markets. It’s a simple saying, but one that investors find easier said than done. That’s because most people are inherently bullish or bearish. They can’t change on a dime.
Once you recognise your bias, you will find it easier to challenge it. The way I do this is by watching the charts. The charts are simply an illustration of what the market is thinking. They reflect not only the fundamentals of a stock or market, but its emotional state as well.
It’s the emotional state of investors that drives prices below or above their fundamental value. If you remain unemotional, you will see this clearly. If you let your emotions dominate, you won’t see this at all.
